Unlock Behavior Insights with the Antecedent Behavior Consequence Chart
Behavior can sometimes feel like a mystery – a mix of actions, reactions, and emotions. Whether you’re a parent trying to decode your child’s tantrums, a teacher managing a classroom, or a behavioral specialist seeking actionable data, understanding what drives behavior is essential. This is where the Antecedent Behavior Consequence (ABC) Chart becomes your most valuable tool. By revealing the root causes and effects of behaviors, it equips you to create meaningful change. Let’s dive into everything you need to know to unlock behavior insights and make a lasting impact.
What Is an Antecedent Behavior Consequence Chart?
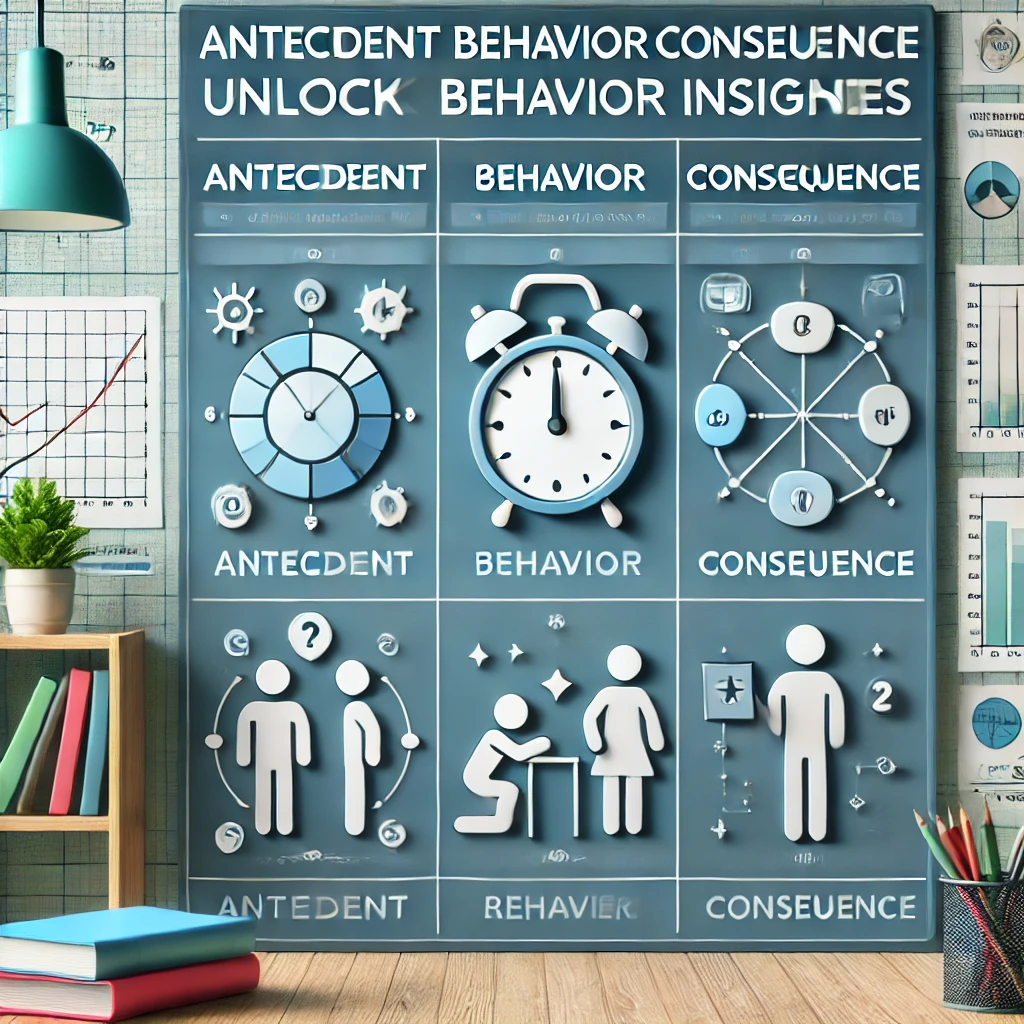
Table of Contents
Definition and Purpose
An Antecedent Behavior Consequence (ABC) Chart is a simple yet powerful tool used in behavior analysis. It captures a detailed record of what happens before, during, and after a specific behavior, helping you identify patterns and triggers. By breaking down behavior into three components, the ABC chart offers insights into why a behavior occurs:
- Antecedent: What happens immediately before the behavior? This could be a verbal instruction, an environmental change, or a specific situation.
- Behavior: The observable action. For example, shouting, hitting, or refusing to follow instructions.
- Consequence: What happens immediately after the behavior? This could be positive reinforcement, punishment, or even no response at all.
The ABC Chart’s ultimate purpose is to provide a framework for analyzing behavior objectively and crafting effective interventions.
Why It’s Important
Understanding behavior is not just about addressing problems; it’s about uncovering the “why” behind the actions. Here are a few key benefits:
- Identifying Patterns: Spot recurring triggers and responses.
- Improving Relationships: Foster better communication between individuals.
- Enhancing Interventions: Develop targeted strategies for behavior management.
How to Create and Use an ABC Chart
Step-by-Step Guide
Creating and using an ABC Chart may sound complex, but it’s a straightforward process when broken into simple steps:
- Define the Behavior
Start by clearly describing the behavior you want to analyze. Use specific, observable terms. For instance, instead of saying “John was disruptive,” write “John shouted loudly and threw his notebook.” - Track the Antecedents and Consequences
Observe and document what happens immediately before and after the behavior. Be as detailed as possible, noting environmental factors, interactions, and reactions. - Record Data Consistently
Use a consistent template or chart to log behaviors over time. Consistency ensures accurate analysis. Here’s an example of an ABC chart format:
| Date | Antecedent | Behavior | Consequence |
|---|---|---|---|
| Jan 16, 2025 | Asked to finish homework | Tantrum | Removed from room |
| Jan 17, 2025 | Told to clean up toys | Cried loudly | Received help |
- Analyze the Patterns
After collecting sufficient data (ideally over two weeks), review the chart for recurring patterns. Identify common antecedents and consequences linked to the behavior. - Develop an Intervention Plan
Use the insights to craft a strategy for addressing the behavior. This might involve altering the antecedent, changing the consequence, or teaching alternative behaviors. - https://youtu.be/UVKb_BXEp5U
Pro Tips
- Be Objective: Record facts, not interpretations.
- Collaborate: Involve others, such as teachers or caregivers, to gather a complete picture.
- Use Technology: Digital tools or apps can streamline the data collection process.
Key Benefits of Using an ABC Chart
For Educators and Parents
The ABC Chart is a game-changer for understanding and managing behaviors in children. It helps:
- Enhance Communication: Share insights with teachers, therapists, or caregivers.
- Reduce Disruptive Behaviors: Identify triggers and implement preventive strategies.
- Support Positive Reinforcement: Reinforce desired behaviors effectively.
For Behavioral Specialists
Professionals in behavior analysis or therapy find ABC charts invaluable for:
- Data-Driven Decisions: Base interventions on clear, objective data.
- Improved Outcomes: Create tailored strategies for individual clients.
- Monitoring Progress: Track changes over time to evaluate intervention effectiveness.
Common Mistakes to Avoid When Using an ABC Chart
While the ABC Chart is a straightforward tool, certain pitfalls can undermine its effectiveness:
- Recording Vague Descriptions
Avoid generalizations like “bad behavior” or “acted out.” Be specific about the actions. - Ignoring Environmental Factors
Failing to note external influences, such as noise levels or group dynamics, can lead to incomplete analysis. - Inconsistent Data Collection
Skipping observations or collecting data sporadically may result in unreliable conclusions. - Bias in Observation
Letting personal judgments or assumptions influence data recording can skew results.
Practical Examples of ABC Chart Use
Case Study 1: A Child with Attention-Seeking Behaviors
Scenario: A 7-year-old frequently disrupts the class by shouting during lessons.
- Antecedent: Teacher calls on another student.
- Behavior: The child shouts, “I have the answer!”
- Consequence: The teacher reprimands the child.
Analysis: The child’s behavior is driven by a desire for attention. A potential intervention could involve giving the child positive attention for raising their hand instead.
Case Study 2: Workplace Stress Management
Scenario: An employee consistently misses deadlines on high-pressure projects.
- Antecedent: Assigned a tight deadline.
- Behavior: Avoids tasks and procrastinates.
- Consequence: Manager gives an extension.
Analysis: The behavior may stem from anxiety. Adjusting deadlines or providing support during projects could help reduce stress and improve performance.
Using Tables for Clear Tracking
Tables are a great way to organize and analyze data from an ABC chart. Here’s how you can structure your chart to maximize clarity:
| Date | Antecedent | Behavior | Consequence |
| Jan 16, 2025 | Teacher asks a question | Calls out loudly | Told to wait |
| Jan 17, 2025 | Classmate takes a toy | Hits classmate | Time-out session |
Using tables ensures that patterns are easy to spot, helping you identify triggers and plan interventions more effectively.
Frequently Asked Questions About ABC Charts
1. What is the purpose of an ABC chart?
The primary purpose of an ABC chart is to identify behavior patterns and provide insights into what triggers and reinforces specific actions. This information helps in crafting targeted interventions.
2. Can ABC charts be used for adults?
Yes, ABC charts are effective for analyzing adult behaviors, such as managing workplace stress, understanding mental health triggers, or improving relationship dynamics.
3. How long should I collect data with an ABC chart?
It’s recommended to collect data over at least two weeks to ensure that patterns are consistent and reliable.
4. Are there tools to help with ABC charting?
Yes, many digital tools and apps are available that simplify the process of tracking, analyzing, and sharing ABC chart data.
5. Can ABC charts be used for group behavior analysis?
Absolutely! ABC charts can be adapted to observe group behaviors, such as classroom dynamics or team interactions in the workplace.
Conclusion: Empower Behavior Change with the ABC Chart
Understanding behavior doesn’t have to feel overwhelming. The Antecedent Behavior Consequence Chart is a powerful tool that empowers you to decode actions, identify patterns, and create meaningful interventions. Whether you’re a parent, teacher, or behavioral specialist, implementing this tool can transform the way you address behaviors.
Start using an ABC Chart today to unlock insights, foster better communication, and build positive relationships. The journey to better understanding and managing behavior begins with your first observation. Take action now and experience the difference it can make!